
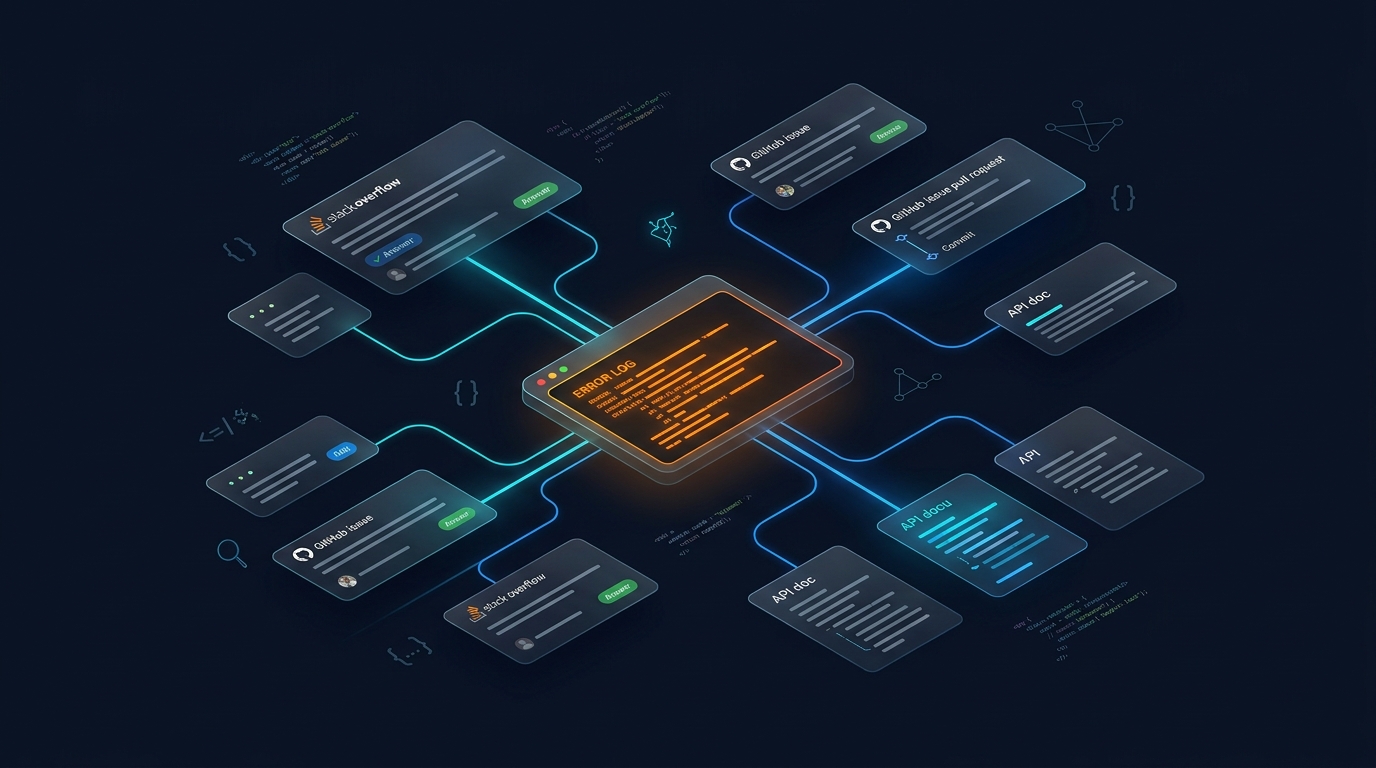
Every software engineer knows the specific anatomy of a deep debugging session:
It starts with a cryptic stack trace in your terminal:
TypeError: Cannot read properties of undefined (reading 'digest')
    at cryptoSubtleHash (auth-worker.ts:84:12)
You paste the error string into Google.
- You open three Stack Overflow threads.
- Thread #2 links to an open GitHub issue in a framework repository.
- The issue comments reference a breaking change in the Node.js v22 Web Crypto API implementation.
- From the Node docs, you branch into the MDN Web Crypto specification, an RFC on HMAC signatures, and an npm package workaround.
Two hours later, you have 38 browser tabs open. You found the one line of code that fixes the bug, but now you have to:
- Document the root cause for your pull request (PR) description.
- Cite the authoritative GitHub issue and RFC for the senior engineer's review.
- Close the tabs without accidentally killing that one obscure forum thread you still need for the unit test.
When you manage debugging research through flat horizontal tabs, reconstructing your investigation path takes almost as long as fixing the bug itself.
Here is how modern developers use visual causality trees to map documentation rabbit holes in real time.
The True Cost of Debugging Tab Sprawl
1. The Context-Switching Tax
Engineers spend an estimated 25% to 35% of their working day debugging and researching documentation. When tabs are arranged in a flat, unorganized horizontal line, the brain constantly wastes micro-cycles scanning truncated favicons to regain context after switching back from the IDE.
2. Loss of the "Smoking Gun"
How many times have you closed a tab after fixing a bug, only to realize 10 minutes later that you need the exact syntax of a configuration flag mentioned in that closed tab? Searching through raw browser history returns 80 identical GitHub and Stack Overflow entries with no clue which one held the answer.
3. RAM Hogging During Local Builds
Running Docker containers, a local PostgreSQL database, Vite dev servers, and heavy language servers like rust-analyzer or TypeScript server is resource-intensive. When Chrome consumes 6 GB of RAM across 50 tabs, compile times slow down and your development environment suffers.
The Engineering Workflow with Agentium Trace
Agentium Trace (free on Chrome and Firefox) is engineered specifically to eliminate research disorientation.
[Google Query: "crypto.subtle digest TypeError"]
  │
  ├─► StackOverflow: "Node Web Crypto in Worker"
  │      │
  │      └─► GitHub Issue #4812 (Framework Repo)
  │             │
  │             ├─► Pinned: "Breaking change in v22 crypto init" (Alt+S)
  │             │
  │             └─► MDN: SubtleCrypto.digest()
  │
  └─► GitHub: Workaround PR #12
Step 1: Automatic Branching in the Native Side Panel
Open the Trace Side Panel alongside your code documentation. Because Trace uses the browser's native Side Panel API, it docks smoothly next to your web view without stealing window focus.
When you middle-click references from a Stack Overflow post or GitHub issue, child tabs branch out underneath the parent automatically. The chronological, causal journey of your investigation is captured with zero manual overhead.
Step 2: Pinning Snippets & Workarounds (Alt+S)
When you find the crucial comment or configuration snippet:
- Select the code block or explanation.
- Press
Alt+S. - Trace attaches the snippet directly to that page node inside your visual tree.
You now have a clean, annotated record of every piece of evidence discovered during the investigation.
Step 3: Hibernate Heavy Tabs to Save RAM
Need to keep 15 documentation tabs alive for reference while compiling your local build? Use Trace's Tab Hibernation to sleep inactive documentation tabs. Hibernated tabs release 100% of their memory footprint, but remain fully indexed and clickable inside your visual tree whenever you need to revisit them.
Step 4: One-Click PR & Post-Mortem Documentation
Click Export inside Trace and select Markdown.
Trace instantly generates a structured debugging dossier:
- High-level investigation timeline.
- Direct links to the root cause GitHub issues and documentation pages.
- All pinned code snippets and quotes formatted as markdown blockquotes.
Copy and paste the markdown straight into your GitHub/GitLab Pull Request description, Linear ticket, or Slack post-mortem. Your team gets crystal-clear context, and code review velocity skyrockets.
100% Local-First: Safe for Proprietary Codebases
Engineering research frequently involves private GitHub Enterprise repositories, internal Jira tickets, staging server logs, and confidential architecture wikis.
Agentium Trace is 100% local-first:
- All session trees, tab metadata, and pinned snippets stay strictly inside your browser's local IndexedDB.
- Zero telemetry, zero external logging, and no scraping of page contents.
- Verified safe for enterprise and security-conscious engineering teams.
Level Up Your Developer Toolkit
Stop letting chaotic browser tabs derail your focus. Map your debugging rabbit holes and keep your train of thought intact.